Hi everyone!
I hope that you enjoyed the exploratory data analysis that I did on the Bike Share Toronto dataset.
At times, you may need to clean up the dataset before you can carry out an EDA and that’s the purpose of today’s post.
I want to show you how I cleaned up the City of Vancouver Greenest City Projects dataset to do some exploratory data analysis.
Reading the CSV File
The first issue that I encountered was when I was converting the .csv file into a DataFrame.
As soon as I ran the following code:
green = pd.read_csv('greenest-city-projects.csv')
The following error message showed up: ParserError: Error tokenizing data. C error: Expected 3 fields in line 9, saw 4
So what happened? There was a problem with the delimiter in the .csv file. Let’s fix the issue by including the separator parameter in the code:
green = pd.read_csv('greenest-city-projects.csv', sep=";")
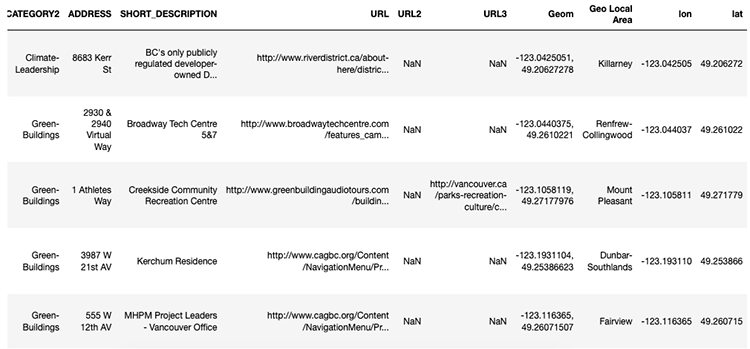
Here’s the head of the DataFrame:
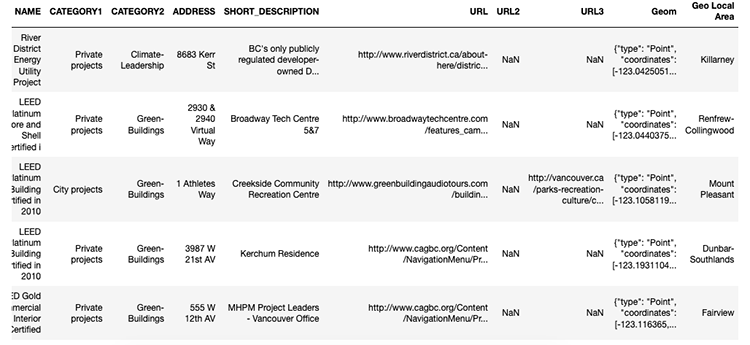
Cleaning Up The Coordinates
Let’s take a look at our Geom column:
As you can tell, this column includes the coordinates of each project.
Before we put that data to good use, we need to do three things:
1. Trim the strings.
2. Separate the data into two columns.
3. Keep the coordinates consistent.
Trimming The Strings
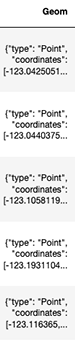
For this first step, we’ll get rid of everything but the coordinates inside the brackets.
These are the characters that must go: {"type": "Point", "coordinates": [ and ]}.
In this case, we’ll use the lstrip and rstrip methods:
green['Geom'] = green['Geom'].map(lambda x: x.lstrip('{"type": "Point", "coordinates": [').rstrip(']}'))
Let’s look at our Geom column now:
Separating The Data
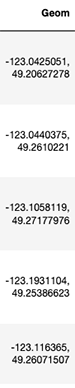
For our second step, we will separate the coordinates into two columns: lon (for longitude) and lat (for latitude).
We’ll use the strip function and separate by the comma:
green[['lon', 'lat']] = green.Geom.str.split(', ', expand = True)
Now let’s see the DataFrame:
Keeping Things Consistent
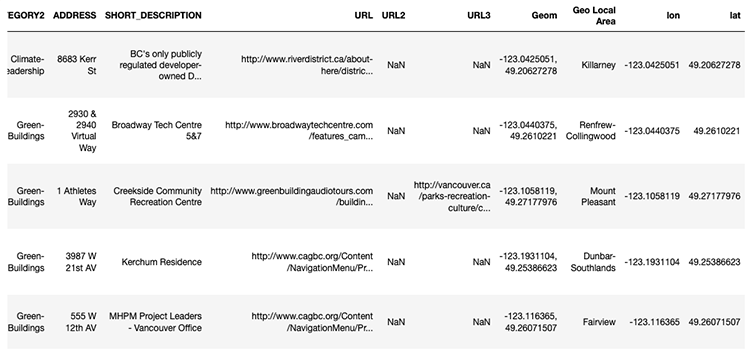
If we look closely at the Geom column, we’ll see that the coordinates use different decimal places.
In order to keep things consistent, we’ll use six decimal places.
For the lon, we’ll keep the first 11 characters by running the following code:
green['lon'] = green['lon'].str[:11]
For the lat, we’ll keep the first 9 characters by running the following code:
green['lat'] = green['lat'].str[:9]
Now we’re using six decimal places!
One Last Thing…
Before we can plot the lon and lat data points, we need to convert them from objects to floats.
Here’s how to do it:
green['lon'] = pd.to_numeric(green['lon'])
green['lat'] = pd.to_numeric(green['lat'])

Plotting The Coordinates
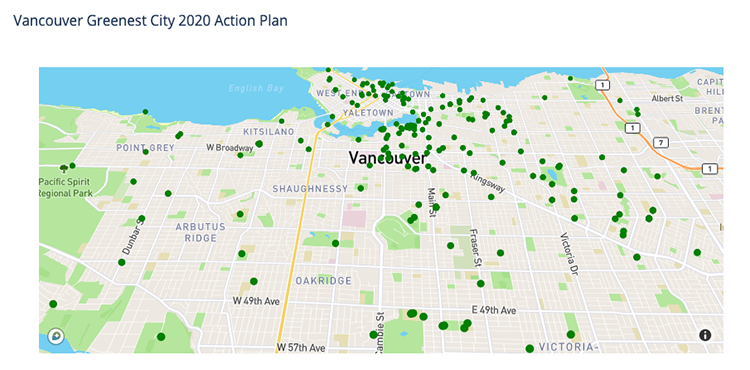
If we hadn’t cleaned up the data, we’d be having a hard time doing our EDA and data visualizations!
As always, feel free to share your comments and/or questions.
Thanks!