Hello everyone!
If you want to understand user behavior, heat maps are a good way to get started.
Just like when we built this map, we’ll go through the steps together to create a heat map. In this example, we’ll be using the Bike Share Toronto Ridership data which you can find by clicking here.
Let’s do this!
Importing Python Libraries
As always, let’s start by importing Pandas and NumPy:
import pandas as pd
import numpy as np
It’s time to import our data visualization libraries:
import seaborn as sns
import matplotlib.pyplot as plt
%matplotlib inline
Let’s Get Our Dataset!
We’ll use Pandas to convert our .csv file into a DataFrame.
q1 = pd.read_csv('Bike Share Toronto Ridership_Q1 2018.csv')
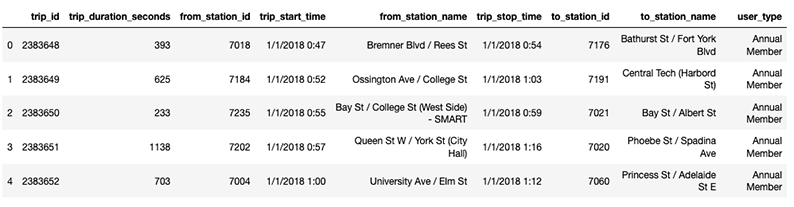
Here’s a quick look at our DataFrame.
q1.head()
Converting Strings into DateTime Objects
Before we start to create our heat map, we need to convert these two string objects, trip_start_time and trip_stop_time, into DateTime objects.
If you are wondering why, it’s because it allows us to grab specific features from our DateTime objects and this will come in handy during our data analysis.
We’ll run the following lines of code to convert our string objects:
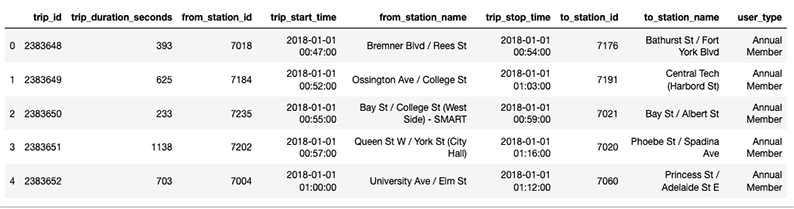
q1['trip_start_time'] = pd.to_datetime(q1['trip_start_time'])
q1['trip_stop_time'] = pd.to_datetime(q1['trip_stop_time'])
Notice anything different about our DataFrame? 🤔
We’re not stopping there though. We’re going to grab three features from our DateTime objects: the hour, month and day of the week.
Let’s use the following code to extract the hour, month and day of the week from trip_start_time.
q1['hour_start'] = q1['trip_start_time'].apply(lambda time: time.hour)
q1['month_start'] = q1['trip_start_time'].apply(lambda time: time.month)
q1['weekday_start'] = q1['trip_start_time'].apply(lambda time: time.dayofweek)
We will do the same for trip_stop_time.
q1['hour_stop'] = q1['trip_stop_time'].apply(lambda time: time.hour)
q1['month_stop'] = q1['trip_stop_time'].apply(lambda time: time.month)
q1['weekday_stop'] = q1['trip_stop_time'].apply(lambda time: time.dayofweek)
Before we take a look at our DataFrame, we will use a Python dictionary to change the integers into strings.
Let’s begin with the month:
month = {1:'Jan',2:'Feb',3:'Mar'}
Let’s continue with the day of the week:
day = {0:'Mon',1:'Tue',2:'Wed',3:'Thu',4:'Fri',5:'Sat',6:'Sun'}
We will now take a look at our DataFrame.
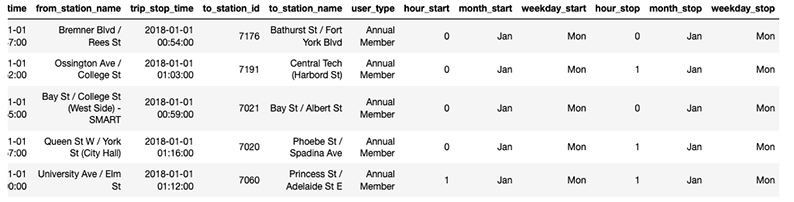
As you can see above, we’ve extracted the hour, month and day of the week from our objects and placed them in separate columns.
(FYI: if you check the 2018 calendar, you’ll see that January 1st was in fact a Monday.)
GroupBy
In order to get our heat map, we must organize the data into groups. An easy way to do this is through the GroupBy function in Pandas.
Let’s say that we want to see how riders used Bike Share Toronto in Q1 2018. In this heat map, we’ll get a glimpse at user behavior: we’ll see when the riders started their trips and ridership peak times.
Let’s group our DataFrame by both the weekday_start and hour_start columns:
user_activity = q1.groupby(by=['weekday_start','hour_start']).count()['user_type'].unstack()
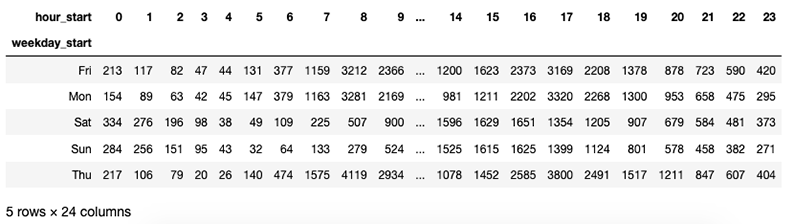
Let’s run the code below to see our matrix:
user_activity.head()
Heat Map Time!
Since we have our matrix, it’s time to create our heat map using Seaborn.
Let’s run the following code:
plt.figure(figsize=(20,10))
plt.title("Bike Share Toronto Ridership - Q1 2018", fontsize=15)
sns.heatmap(user_activity, cmap='coolwarm')
Here’s our result:
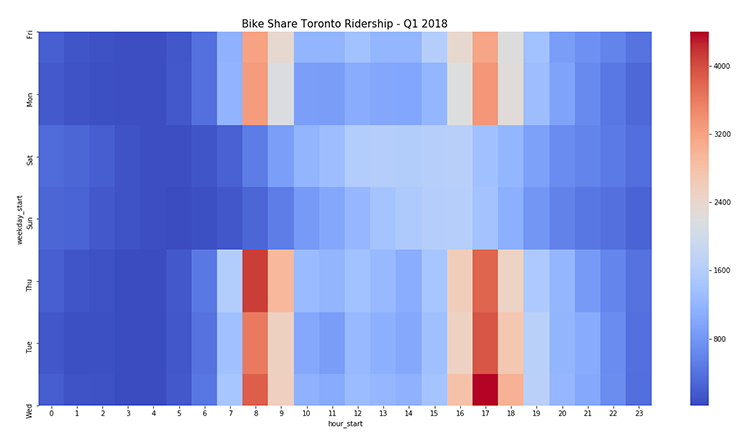
What Can We Tell From This Heat Map?
1. In the first 3 months of 2018, riders were using Bike Share Toronto mostly on weekdays.
2. Tuesday, Wednesday and Thursday were the most active riding days during the week. From Monday to Friday, the peak times were between 8am-9am and 4pm-6pm.
3. During the weekend, Saturday was the most active day and people were riding around Toronto mostly between 10am-6pm. On Sundays, it was between 12pm-6pm.
I am curious to see how the Bike Share Toronto Ridership data evolved throughout the rest of the year; especially, during the warmer months.
If you have any comments or questions, feel free to reach out!
Thanks!