Hello everyone!
One of the things that I enjoy the most about Python is using the power of Seaborn.
In case you are not familiar with what Seaborn is, it’s a powerful data visualization library to make your data look amazing; plus, it gives you capability of customizing your graphs as you see fit.
Going back to the NYC AirBnB exploratory data analysis, I want to show you something cool that you can do with Seaborn.
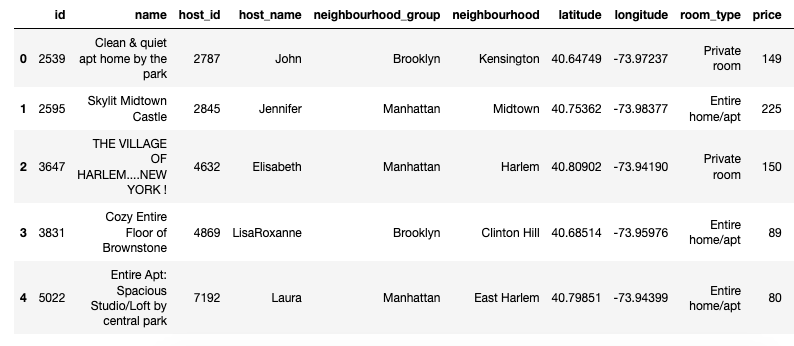
If we take a look at the DataFrame, we’ll see that it includes the coordinates for the AirBnB listings in NYC:
I’m going to use Seaborn’s Scatterplot to map out the AirBnB listings by borough:
I’ll start by sizing it appropriately:plt.figure(figsize=(20,20))
Now, I’ll go ahead and set everything up:sns.scatterplot(data=nyc, x='longitude', y='latitude', hue='neighbourhood_group')sns.set_style('whitegrid')
Here’s what it looks like:

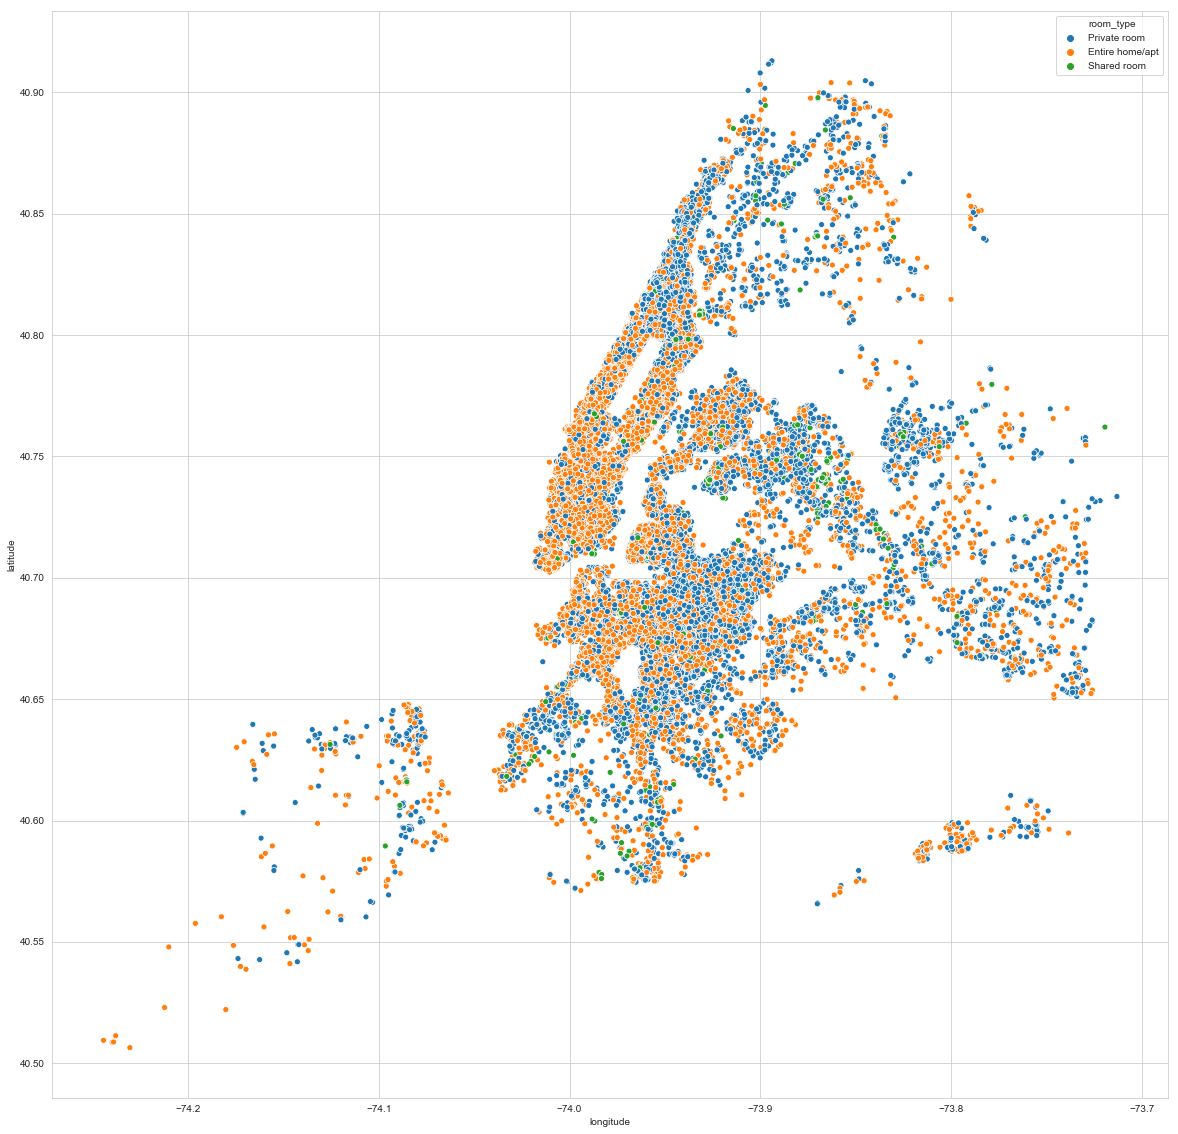
If I were to do it by listing type, I simply change the hue to hue='room_type' and this is what New York City looks like:
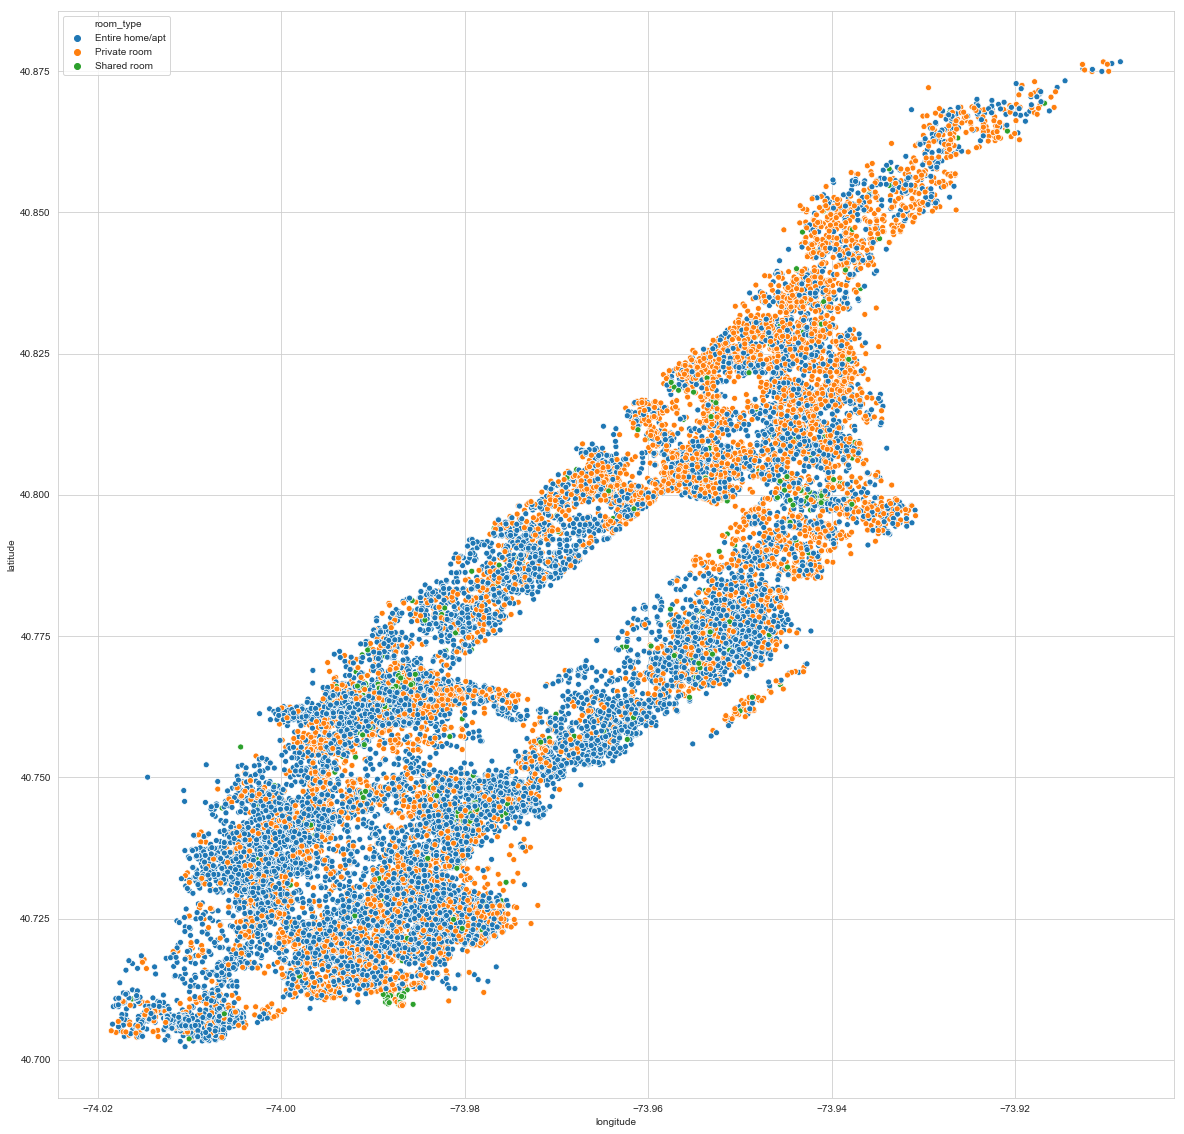
Now, let’s take a look at the boroughs with the most AirBnB listings:
Manhattan by listing type:
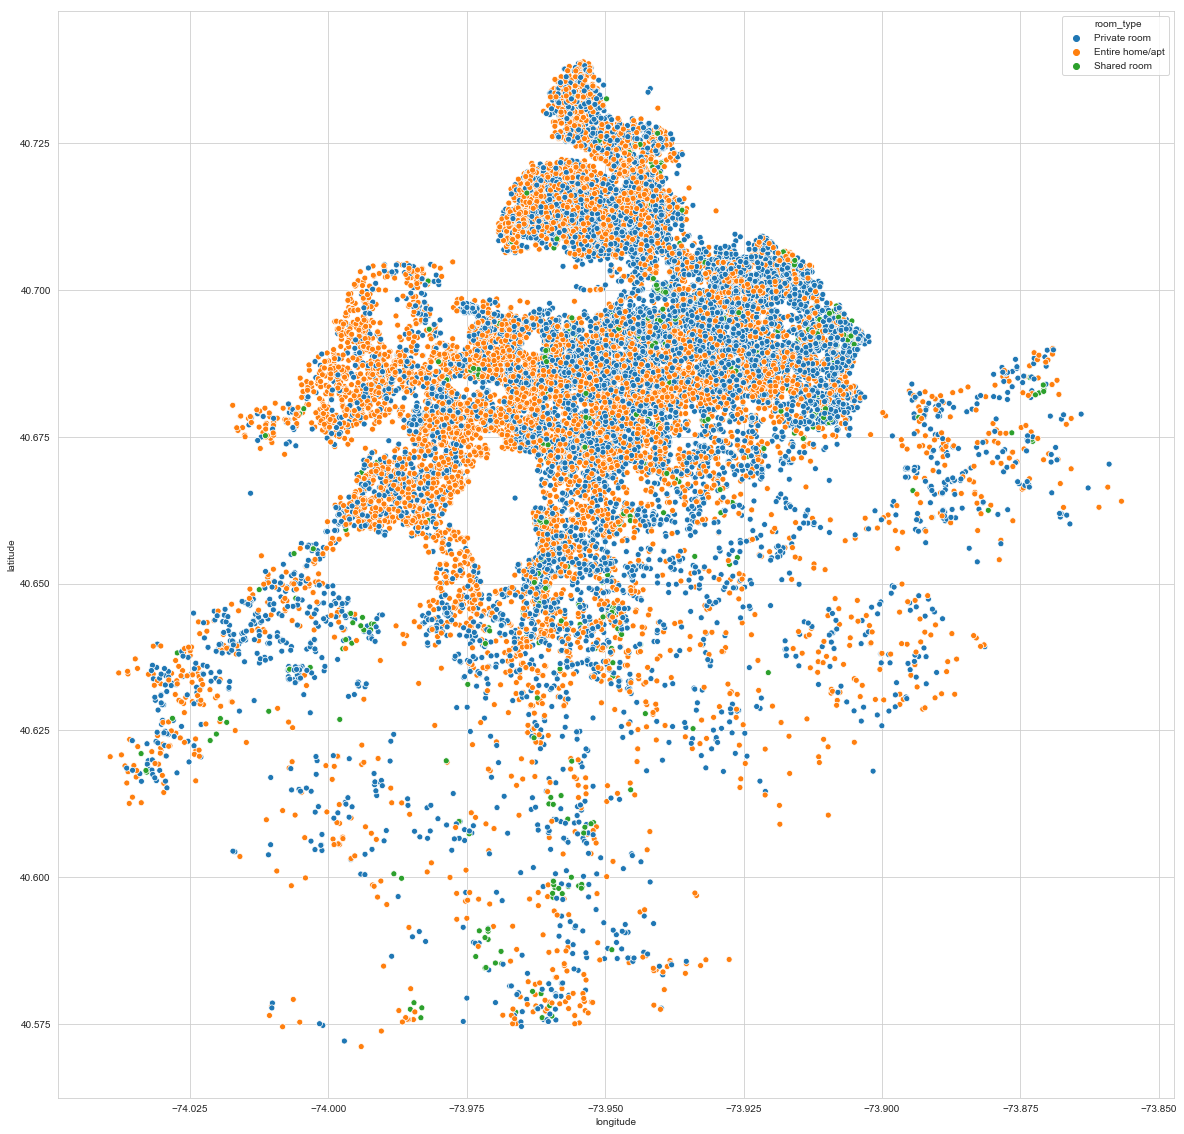
And Brooklyn by listing type:
That’s nice, right?! There’s so many other things that you can do with Seaborn!