Over the past weeks, I’ve covered a good number of survey question mistakes to avoid. I hope that these articles help you during the survey design process.
Once that is taken care of, consider calculating your sample size. I want to walk you through the entire way.
Let’s begin with a simple question:
What is a Sample?
A sample is used when there’s a considerable population size. The group is representative of the entire population and remains unbiased.
Here’s an example: imagine that you want to test a new feature for Android phones. It’s almost impossible to reach out to every Android user; instead, use a sample from a large Android user population.
Very important: if you’re only considering specific brands and/or smartphone models, it will affect your survey data and insights. Choose randomly to avoid bias.
Moving forward, let me break down the elements of the sample size calculation for you.
Population Size
This is the amount of respondents that you’ll be able to reach with your survey.
Using the Android feature example, let’s say that there are 10,000 Android users in your city. This is your population size.
Margin of Error
This is the value that defines the variance between the views of the sample and of the entire population.
A standard survey usually uses a margin of error of 5%. The higher the percentage, the lower the confidence that the survey results reflects the population. It is recommended to keep it under 10%.
Let me explain the margin of error concept using the Android feature example.
Imagine that 72% of the participants find the Android feature useful. With a margin of error of 5%, the range of the population that actually finds it useful is between 67% – 77%.
In this example, we add the margin of error to both ends of 72%.
Confidence Level
It’s a percentage that reveals the accuracy of your survey results. Confidence levels show how often the results land within the margin of error.
Researchers tend to use a confidence level of 95% in their surveys. Lower confidence levels increase the chances of imprecise survey results. Try to keep it above 90%.
Let me go further using the Android feature example.
A confidence level of 95% means that we are 95% sure that the true percentage of the population will land within the 67% – 77% range.
Keep a close eye on confidence levels, they help us to validate our survey results.
Calculating the Sample Size
You need these 3 things to calculate the sample size:
Population Size
Margin of Error
Confidence Level
Let’s take a look at the following formulas:
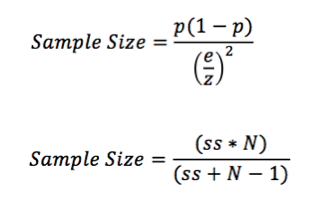
p = Normal Distribution (50% is standard, in decimal form)
e = Margin of Error (in decimal form)
z = Confidence Level (use z-scores: 99%: 2.58; 95%: 1.96; 90%: 1.65)
ss= Sample Size
N= Population
The first formula enables you to calculate a preliminary sample size without having a population. With the second one, you can include the population to calculate a definite sample size.
Let’s go back to the Android feature example.
If I were to calculate a preliminary sample size, I would use a normal distribution of 50%, a margin of error is 5% and the confidence level is 95%. The result is 384.16.
Now that I have a preliminary sample size, I want to calculate a definite one. If my population is 10,000 users, my sample size comes to 370.
If you don’t want to do the calculations by hand, there are online calculators to assist you.
Now that you have the right sample size, you are ready to plan accordingly, move forward with your survey and take control of the accuracy of your survey results.
Have you calculated your survey’s sample size before? Share your experiences in the comments.